Mapping theory into a financial model allows for better understanding of the finer points of corporate finance. The linkages within a model provide for a closer scrutiny of the trade-offs amongst the inputs and interpretation of the relationships in more succinct ways than is otherwise possible. Such observations can clue us in to the subtle nuances and yield significant insights when formulating competitive strategies to underpin value creating possibilities.
Let’s review the financial modelling that we have created for the purpose of analysis and valuation of companies. Key elements for assessing value creation include: Earnings Before Interest Taxes ( EBIT), Taxes Paid, Invested Capital, Debt and Equity, Return on Invested Capital ( ROIC ), Weighted Average Cost of Capital ( WACC ), Free Cash Flow ( FCF).
When we build a model from scratch, we have full control of the assumptions (inputs) fed into it. We are also able to reconcile the numbers from different perspectives (triangulation) and calibrate the degree of completeness, internal consistency and accuracy of the formulation of the model.
From the financial model that has been built, we are able to determine the FCFs for the respective years.
|
FCF Calculation |
Year 1 |
Year 2 |
Year 3 |
|
|
EBIT |
$ 716,000.0 |
$ 3,156,000.0 |
$ 4,979,000.0 |
|
|
Add: Goodwill |
$ - |
$ - |
$ - |
|
|
Adjusted EBIT |
$ 716,000.0 |
$ 3,156,000.0 |
$ 4,979,000.0 |
|
|
Income Tax Expense on EBIT |
$ (887,500.0) |
$ (1,048,500.0) |
$ (2,639,500.0) |
|
|
Changes in Deferred Taxes |
$ 800,000.0 |
$ (200,000.0) |
$ (200,000.0) |
|
|
NOPLAT |
$ 628,500.0 |
$ 1,907,500.0 |
$ 2,139,500.0 |
|
|
Depreciation |
$ 2,000,000.0 |
$ 2,400,000.0 |
$ 2,800,000.0 |
|
|
Proceeds from disposals |
$ - |
$ - |
$ 1,500,000.0 |
|
|
Gross Cash Flow |
$ 2,628,500.0 |
$ 4,307,500.0 |
$ 6,439,500.0 |
|
|
Increase / (decrease) in working capital |
$ 133,500.0 |
$ 117,500.0 |
$ 85,500.0 |
|
|
Capex |
$ 10,000,000.0 |
$ 2,000,000.0 |
$ 2,000,000.0 |
|
|
Increase in other assets, net of liabilities |
$ - |
$ - |
$ - |
|
|
Investment in operating leases |
||||
|
Gross Investment |
$ 10,133,500.0 |
$ 2,117,500.0 |
$ 2,085,500.0 |
|
|
FCF before Goodwill |
$ (7,505,000.0) |
$ 2,190,000.0 |
$ 4,354,000.0 |
|
|
Investment in Goodwill |
$ - |
$ - |
$ - |
|
|
Free Cash Flow |
$ (7,505,000.0) |
$ 2,190,000.0 |
$ 4,354,000.0 |
How to extend to the rea l world? - sourcing for XBRL-based data
The challenge comes where transcribing real world data sets where the availability ( or non-availability ) of data points requires us to find workarounds to extract and or impute the facts e.g. FCF, NOPAT etc. for the financial model.
We will need to source and transcribe real-world datasets into the model in order to test the efficacy of the model. This is what we meant by extending theory into practice. The internet has been an excellent enabler where meaningful real-world datasets can be sourced, albeit up to now, the process is tedious and or costly. With the advent of XBRL (extensible business reporting language aka digital financial reporting) as a standard that is increasingly been adopted by jurisdictions worldwide, data consumption can now be quick, easy and repeatable – important prerequisites for integrated thinking and reporting
However, when we review the XBRL taxonomy, we will notice very quickly that the facts may not be consistently tagged to allow for quick, easy and repeatable extraction. And if we want to compare the FCFs across companies within the same industry, we may run into further obstacles such as differing label names been used by filers, for the same(comparable) facts.
The workarounds will be to reformulate the way FCF is computed and extract the relevant facts to impute the FCF. For example, we can simplify the FCF formula as follows:
|
CashFlow: Increase (Decrease) In Cash |
2,407,500 |
2,000,000 |
3,330,250 |
|
|
Non- FCF Components |
||||
|
Financing Item: Repayment (Injection) |
(10,000,000) |
0 |
858,750 |
|
|
Add: Interest Expense(1-TaxRate) |
102,500 |
215,000 |
190,000 |
|
|
Less: Interest Income(1-TaxRate) |
(15,000) |
(25,000) |
(25,000) |
|
|
(7,505,000) |
2,190,000 |
4,354,000 |
The matching concept names are as follows:
|
Ref |
Fundamental Concept Name |
Taxonomy Concept Name |
|
1 |
CashFlow: Increase (Decrease) In Cash |
us-gaap:CashAndCashEquivalentsPeriodIncreaseDecrease |
|
2 |
Net cash provided by (used in) financing activities |
us-gaap:NetCashProvidedByUsedInFinancingActivities |
|
3 |
Interest Expense |
us-gaap:InterestExpense |
|
4 |
Interest Income |
us-gaap:InvestmentIncomeInterest |
|
5 |
Statutory tax rate on earnings from continuing operations (as a percent) |
us-gaap:EffectiveIncomeTaxRateReconciliationAtFederalStatutoryIncomeTaxRate |
Using the taxonomy concept names, entity central index key ( unique for each company )and the URLs for the10-K/Q filings, we can programmatically extract the facts to impute the FCFs.
Why is XBRL a game-changer?
FCF is a key metric for understanding the underlying business model and to determine the quantum of future cash flow that underpins its enterprise value today. FCF when analysed in conjunction with other metrics i.e. ROIC and WACC, allows analysts to quickly size up the value creation potential of the business model. There are many other metrics that are equally important for benchmarking and analytical purposes. A simple, fast and repeatable way to extract the relevant facts will be via the XBRL pathway.
Recap of the work flow steps
The above steps form an integral part of the learning and growing processes that companies must undergo in building an A team capable of strategizing and executing winning value proposition for sustainable value creation. We recap below the steps for ease of reference.
|
Step |
Task |
Rationale |
Comments |
|
1 |
Maintain financial model |
Workshop available: |
|
|
2 |
Extract real-world datasets via XBRL |
Workshops available:
|
Experiment has shown that with a real-world datasets of 12 companies with 5 years of 32 metrics that the extraction will take not more than 2 minutes using the XBRL route as opposed to 10 hours using the manual copy-and-paste route |
|
3 |
Analyse the metrics across companies to gain insights |
|
|
|
4 |
Make decision following the analysis / insights |
|
The end product and takeaways
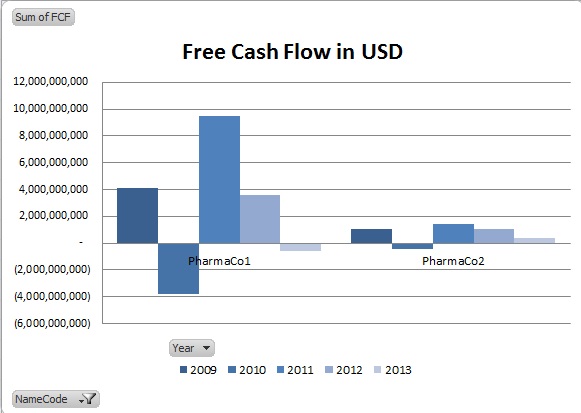
The chart below reflects the data sets for the FCFs from Year 2009 through 2013 for 2 pharmaceutical companies. The FCFs can be a starting point to ask some pointed questions.
There is significant productivity gain as evident from the table below. There is minimal
manual copy-and-paste task ( <2%) in the entire process. In the programmatic extraction, the bulk of the work is attributed to value-added thinking activities that should command a premium in the workplace as it represents real productivity. In fact the bulk of the time ( at least 80% ) will be dedicated to analytical work shaping the value creating story, seeking out patterns through visualisation, identifying subtle nuances of the presentation that can clue us in as to the efficacy of the underlying value proposition, competitive advantages / strategies etc.
|
Ref |
Programmatic extraction |
Value Added Activities |
||
|
Task |
Extraction |
Conceptualisation of fundamental principles |
Coding |
Critical analysis |
|
Time Taken / Allocated |
<2% |
5% |
5% |
>80% |
|
Frequency |
1x accretive (as and when there are new filings)
|
1x
|
1x |
Ongoing triangulations – to gain deeper and deeper insights |
Who should be interested?
Regulators, strategic planners, accountants, finance professionals, analysts and or stakeholders with roles in supervision, strategy and execution; interested in data consumption e.g. extracting companies’ key metrics for benchmarking purposes, in their course of work.
What do you think?
We would like to seek your view on the trend for digital financial reporting i.e. Do you believe that it will pave the way for the democratisation of data? Will this be a critical skill for Accountant2.0 to attain if he/she wants to remain relevant in the cloud-based, mobile-ready environment.